Table of Contents
Highlighting License Costs for Disabled and Inactive Users with Color
The Microsoft 365 Licensing report is one of the more popular scripts I’ve written. The last set of updates added analysis of licensing costs by department and country. I maintain a list of things that people have asked me to add to the script. Last week, I wanted to take a break from the work to prepare the new edition of the Office 365 for IT Pros eBook, so I fired up Visual Studio Code and got to work.
On my to-list were the following:
- Highlight disabled counts better and report the cost of licenses assigned to disabled accounts.
- Highlight the cost of licenses assigned to user accounts that haven’t signed in for 90 days or more.
- Add Excel worksheet output using the ImportExcel module.
- Categorize the license spend for individual user accounts to be under, average, or high based on the average cost for the tenant.
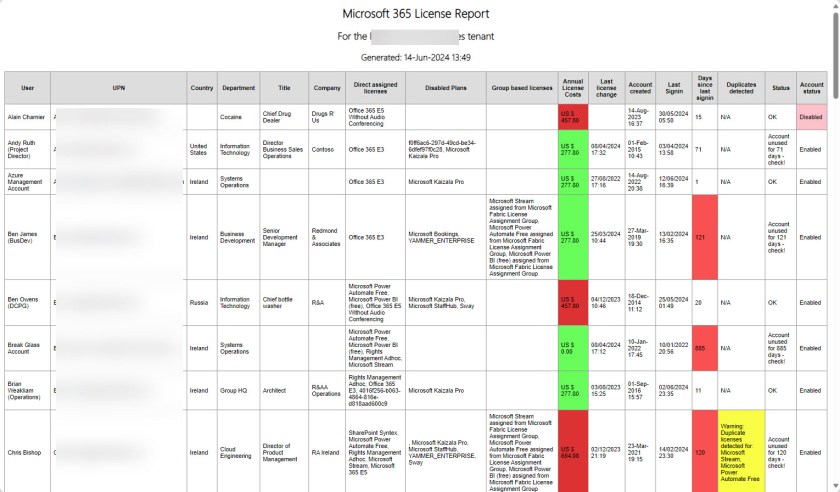
- Use color to highlight important points in the HTML report (Figure 1). I’m color blind, so the colors I selected to highlight different values might not be to your taste. If so, feel free to select different colors and modify the script by inserting the hex code values of those colors into the style sheet for the report.
- Fix some small bugs. There’s always a couple to clean up.

Summarizing Licensing Costs
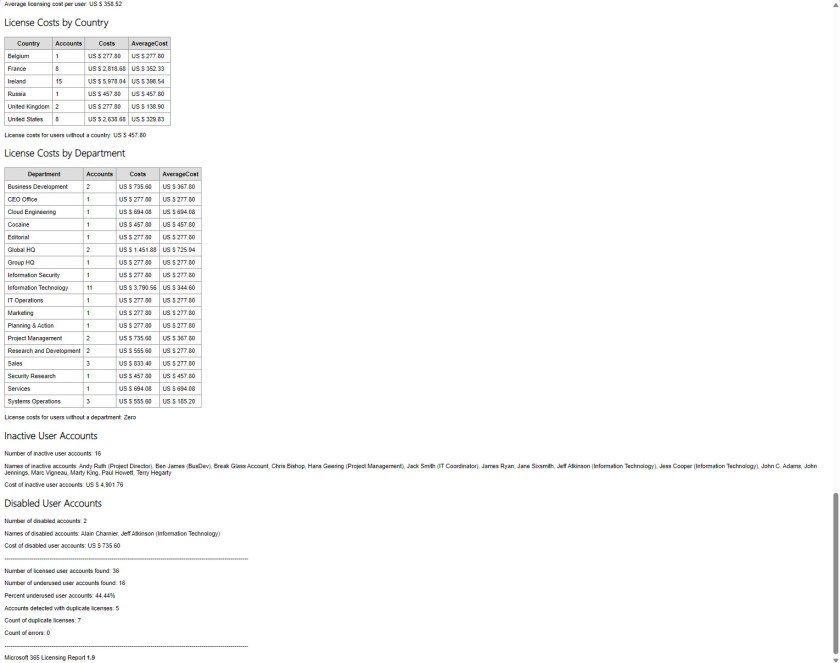
Figure 2 shows the updated summary of costs generated at the end of the HTML report. The cost analyses by country and department were in the last update, but I fixed a bug where the report didn’t deal as well as it should do when no licenses are assigned to accounts without a department or country.

The new information is in the section for inactive user accounts and disabled user accounts. Each category lists the set of user accounts that match the criteria together with the total cost of licenses assigned. I used 90 days since the last sign-in to decide if an account is inactive. It’s easy to modify the script to use a higher or lower value, depending on how long it takes before your organization considers an account to be inactive.
Generating an Excel Worksheet for the Licensing Data
Many PowerShell scripts generate CSV files for their output. It’s natural that this should be the case. The Export-CSV cmdlet is part of base PowerShell, and the CSV file format is easy to work with and the data is easy to import back into a PowerShell array.
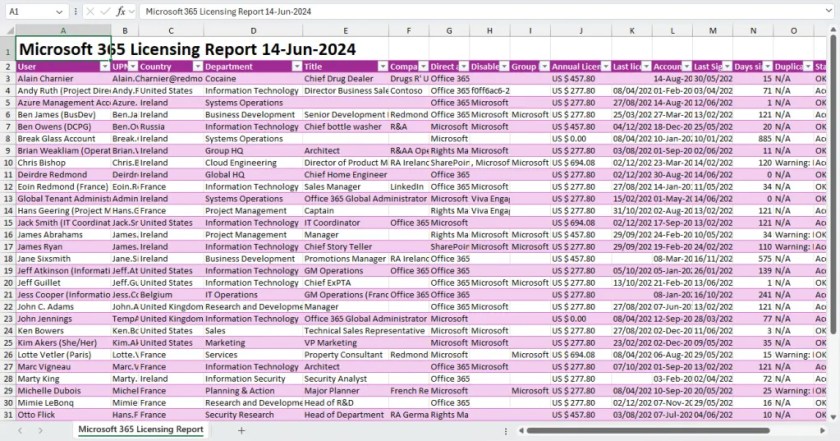
Some of the CSV files end up as Excel worksheets. It’s easy to do this by opening the CSV file with Excel and saving the file as a worksheet. The ImportExcel module supports the generation of worksheet in many different styles with data inserted into a table ready to be analyzed (Figure 3).

The script checks if the ImportExcel module is available. If it is, the script generates an Excel worksheet. If not, the licensing data is exported to a CSV file.
Important Note and How to Get the Script
If you haven’t run the script before, make sure to read these Practical365.com articles to understand how the script works, how to generate the two (SKU and service plan) CSV files used by the script, and how to add cost data for Microsoft 365 subscriptions. Basically, some up-front work is necessary to prepare reference data for the script to use in its analysis. The code can extract details of user accounts and their assigned licenses from Entra ID, but turning GUIDs into human-friendly product names requires some help. The cost of Microsoft 365 subscriptions differs from country to country too.
You can download V1.9 of the script from GitHub.
Microsoft 365 tenants can have large quantities of licenses to manage. This script might help as written, or inspire you to create your own version tailored to the needs of your organization
Support the work of the Office 365 for IT Pros team by subscribing to the Office 365 for IT Pros eBook. Your support pays for the time we need to track, analyze, and document the changing world of Microsoft 365 and Office 365.
2 Replies to “Version 1.9 of the Microsoft 365 Licensing Report”